


Mid-America Apartment Communities Q4 2023 Update

We’re covering the Q4 2023 earnings for Mid-America Apartment Communities (MAA) MAA 0.00%↑.
We’re considering an investment in the REIT, though we’re particularly cautious about the macro environment today. It would be nice to see shares get pounded needlessly before buying.
Warning: This report turned out much bigger than expected. There’s a “summary” section at the end for people who want it condensed down to a paragraph. However, I think this serves as a more substantial update for investors who want to know more about the REIT. Somehow my goal of 500 to 700 words turned into an article length of about 3,000.
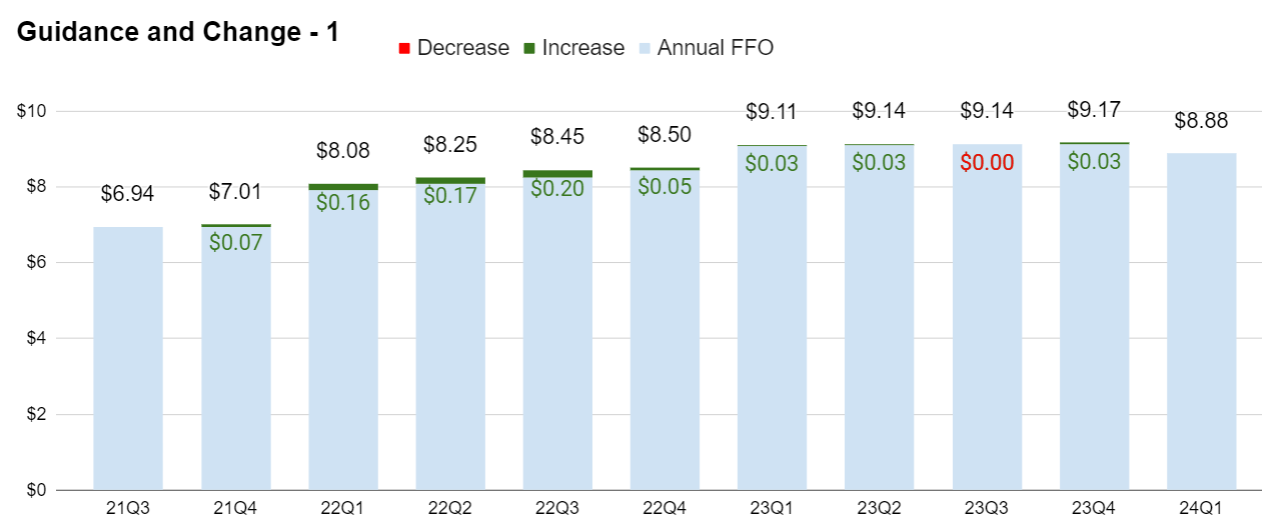
Core FFO Per Share
2023: $9.17
2024 Guidance midpoint: $8.88
Range: $8.68 to $9.08
Same Property Net Operating Income
This is often listed as SS NOI (same-store net operating income). I will regularly refer to it as SS NOI.
SS NOI projected growth rate: -2.8% to +0.2%
Midpoint: -1.3%
Supply Headwinds
See our recent article on Camden Property Trust (CPT) CPT 0.00%↑ for discussion of supply headwinds.
I expect these headwinds to hit MAA a little harder than any of the other housing REITs. That’s in line with our projections from a couple of years ago as well. Following the pandemic, there was a surge in rental rates that was most pronounced around the sun belt markets. It drove amazing leasing spreads and stimulated a huge volume of new construction in those markets.
FFO or Core FFO Guidance
Over the last few years, there haven’t been any negative revisions to FFO.
Leasing Spreads and Vacancy
Leasing spreads are a leading indicator for REIT performance.
The following chart demonstrates the leasing spreads and vacancy rate by quarter: