


Portfolio Update - August: Rates Drop, REITs Soar

Warning! We’re in the middle of earnings season. There really isn’t much time to push out a comprehensive update.
Normally, that means this update could take weeks.
Or, I could just update the charts and share my thoughts.
We’re going for an all-time record for the fastest end-of-month update we’ve ever published: Hours after the last market close for the month.
There’s probably some typos. Sorry about that. Cost of speed.
Interest Rates
What a month!
Treasury rates are around the lowest levels year-to-date.
This afternoon Jerome Powell was telling investors that a rate cut could be on the table for September if inflation continues trending down.
It’s about time. When interest rates were 0%, the debt wasn’t such a big deal. However, with much higher rates, interest expense is set to strangle the budget and leave the next generation with a legacy of debt.
That $34 trillion of debt, nope, just updated, $35 trillion of debt, was used to pay for…
Can you recall?
I’m checking my notes.
Here it is:
“A bunch of junk that wasn’t worth $35 trillion”.
Well, that’s not particularly helpful.
Using the data the government provides for forecasting (which in my experience is more likely to be optimistic than pessimistic), interest expense will grow from $240 billion in 2016 to $1,440 billion in 2033.
That is higher than an 11% compound annual growth rate in interest expense.
According to the projections, at that point, about 3.67% of GDP will go to interest expense.
That’s going to weigh on productivity.
$1.44 trillion in interest expense would exceed the total deficit from the 2009 financial collapse.
That’s not adjusted for inflation, but it provides some context for the premise of $1.44 trillion.
Despite the ongoing deficits, inflation is finally dying down.
Note: I think most people across the entire political spectrum will agree that our country got less than $35 trillion in value from the accumulated debt. We’re not going into how to fix it (just say no to political pandering), but paying out an extra trillion per year in interest expense absolutely is not part of any solution.
The charts below (from MBSLive) show the drop in Treasury yields since the end of June.
5-Year Treasuries:
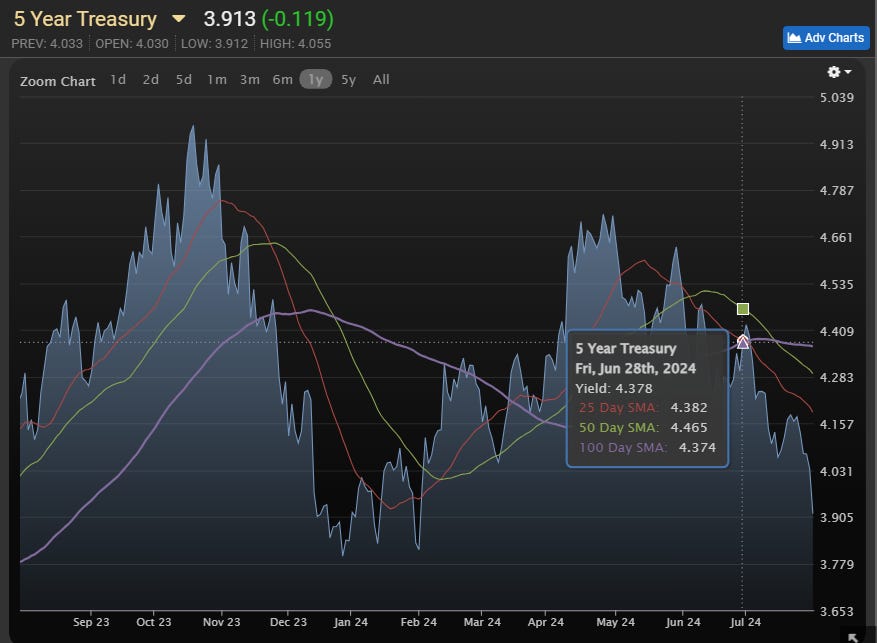
2-Year Treasuries:
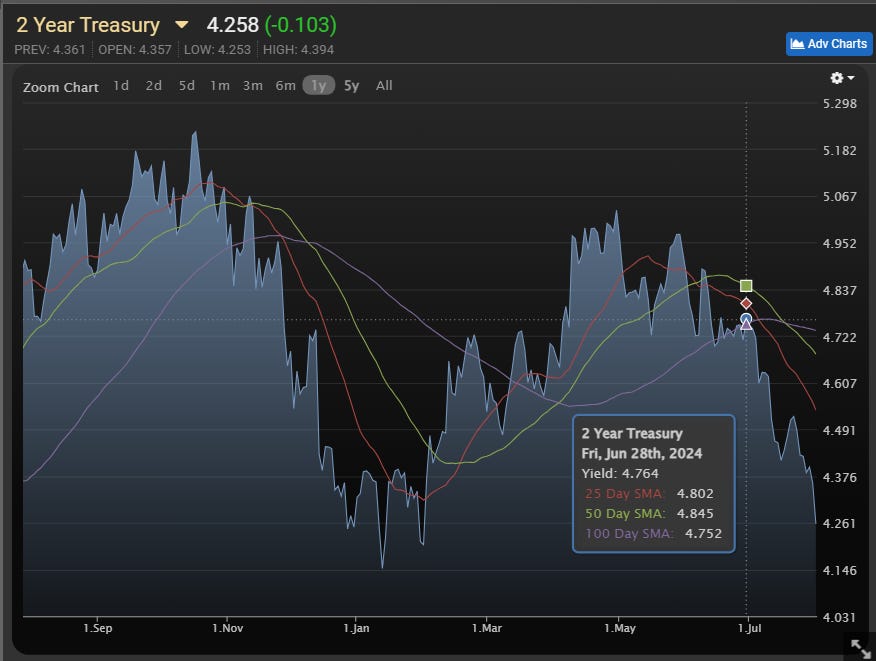
As interest rates fell, we also reported our best single-month gain of the year.
On the other hand, our year-to-date alpha declined slightly. A huge drop in rates can be very helpful for some of the weaker and higher-risk securities.
Our modest cash allocation (about 7.13% at the start of June) was also weighing our performance. Most of that cash is earning interest at short-term Treasury rates, but that’s still less than 0.5% for the month.
Article Starts
You can find prior installments of the Portfolio Updates on the Portfolio tab of our website.
Older editions of the Portfolio Update are unlocked for everyone. The newest release reserves the foreshadowing section for paid members.
Trade Alerts
We have a page on Substack to link all trade alert articles.
Here are The REIT Forum’s trade alerts.
Layout - Modified Order
To keep things simple for our investors, the rest of the portfolio update is divided into several segments. We run the same segments (with new content) each week.
We usually maintain the same order from month to month, but I revised the order to work better with free previews. Eventually, the order will be locked in again.
Returns on Total Portfolio
Sector Allocation
Reminder About Cash
Housekeeping
Recently Closed Positions with Returns
Recently Opened Positions with Returns
All Open Positions by Sector with Returns
Outlook
Foreshadowing Potential Trades (paid section)
This layout maximizes transparency while keeping the foreshadowing of our potential trades within the paid section. It also loads the images together at the front, while putting the text-heavy sections together at the end.
Returns on Total Portfolio
Note: The presentation of the charts was modified slightly to enable running it through Google Sheets instead of Excel to reduce transferring data.
The chart below shows our performance since we began preparing for The REIT Forum at the start of 2016 through the end of the latest month:
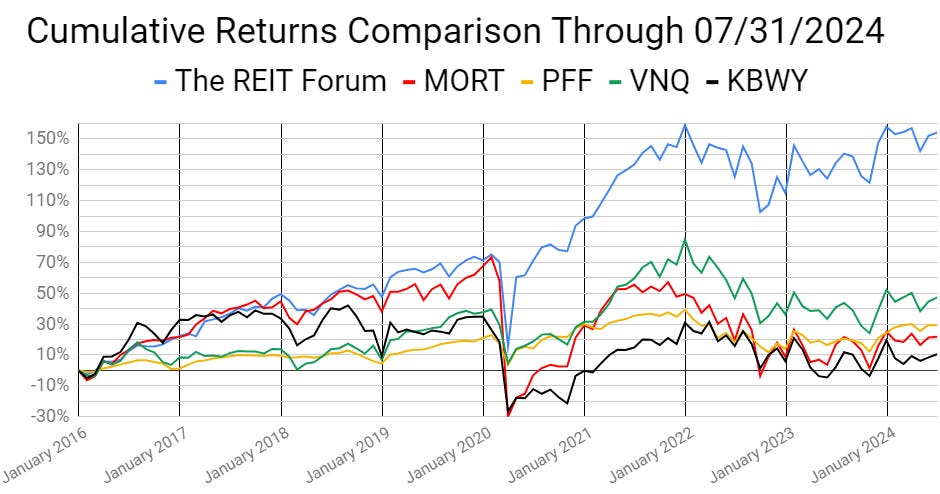
There are four major index ETFs we use for evaluating performance. They are:
(MORT) $MORT - Major mortgage REIT ETF
(PFF) $PFF - The largest preferred share ETF
(VNQ) $VNQ - The largest equity REIT ETF
(KBWY) $KBWY - The high-yield equity REIT ETF most retail investors follow
Annual comparison vs. each ETF:
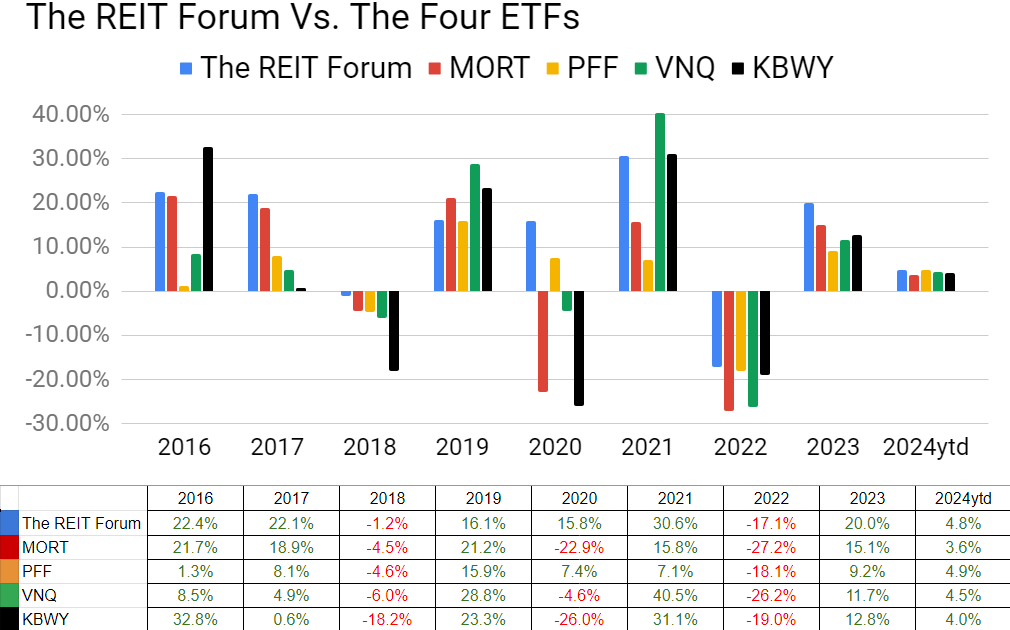
Our performance vs. the average of the ETFs:
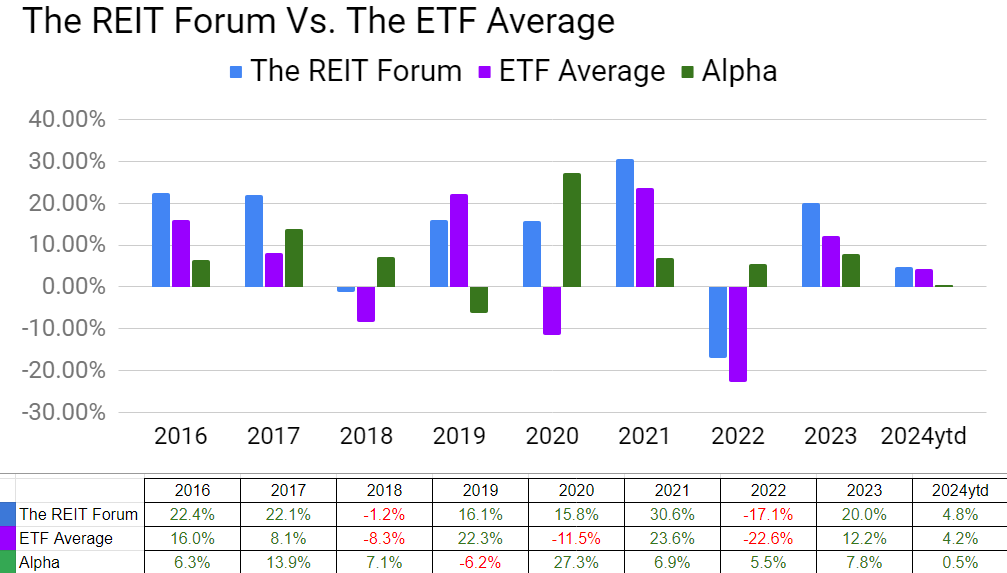
We evaluate alpha based on performance against the ETFs because it strips out the general change in our sectors.
The next chart shows the change in the value of our portfolio from month to month. We strip out the impact from contributions made during the month because, obviously, contributions are not returns.

The prior year is included as well to help investors see how the calculations work.
If anyone is confused by these calculations, let me know. I believe this transparency is crucial, so I’ll include an example showing every calculation if I hear that readers have any difficulty following it.
Sector Allocation Chart -
The sector allocation chart helps to explain how we are thinking about risk and seeking returns:

Reminder About Cash (repeated)
I normally keep at least 6 months or more of living expenses in “cash”. If you normally keep around $40k to $50k in “cash”, the difference between getting paid 5% and 0.2% is around $2k per year.
I’m using (SGOV), (SHV), and (BIL) as my cash substitutes. These are short-term Treasury ETFs. Prices are extremely stable. Liquidity is excellent.
I use a Schwab business account that is not part of my portfolio. The only assets it holds are actual cash and cash substitutes (those 3 ETFs).
Nearly all my expenses go through my credit card already (paid off in full each month).
I still have my checking through USAA because of the long history on those credit cards. If I need cash, I can sell Treasury ETFs and transfer the funds to my USAA account.
It takes a few days, but that’s fine.
This is a pretty nice return for cash I was going to have there anyway.
Note: Some people think you don’t need a strong credit score after getting a mortgage. I disagree. The long history on those cards is extremely useful if I want to boost someone’s credit score. If I add someone to my card, their next update will show they have a card with 20 years of perfect history.
You can get scammed this way. You are liable for the bill. They can just charge the card and walk away. This doesn’t concern me because I keep a lower limit (such as $10k) on those cards and I’m only doing it for people I trust. If one of those people betrays me, I’ll count myself lucky that I found out for only $10k. For people who can’t afford to risk that money, this would be too dangerous.
Housekeeping
We used to have a repeated section on strategy, but I wanted to shorten the update.
I’ll be posting an article that covers our strategy in greater depth and just adding a link to that post.
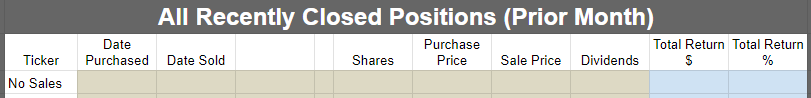
Recently Closed Positions with Returns
These are the positions closed during the prior calendar month. If you want to see positions that were closed before that, you can see the prior portfolio updates or use the Google Sheets.
If we didn’t close any positions for the sector during the month, then the image will be blank.
Note: By loading the Google Sheets, you can still see all of our closed positions. We only include the recently closed positions to reduce the size of the article:
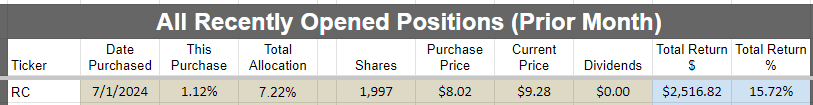
Recently Opened Positions with Returns
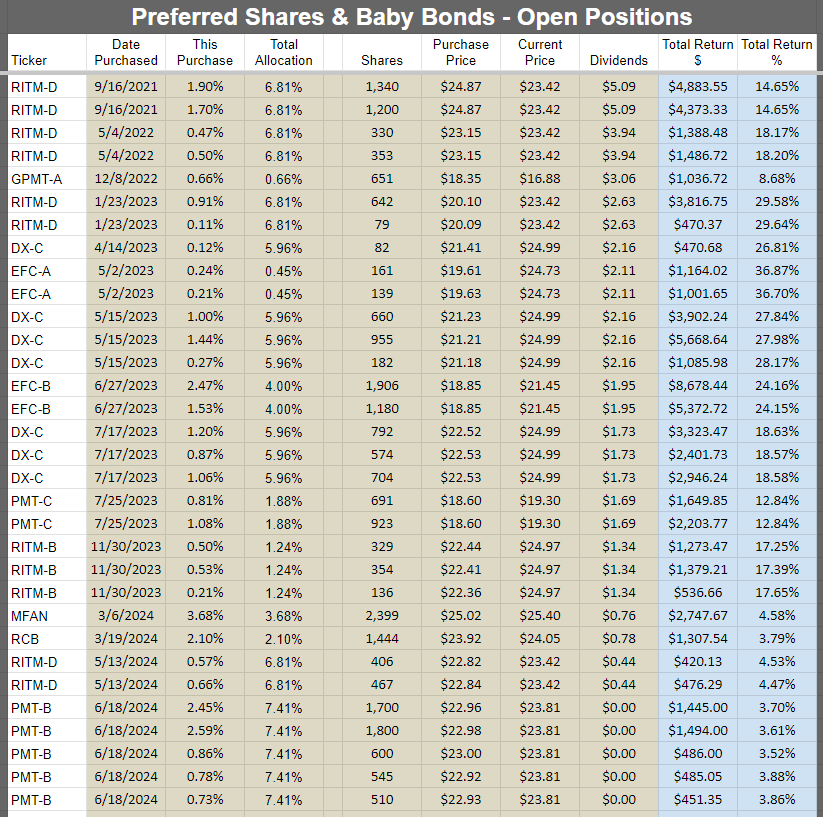
All Open Positions by Sector with Returns
We will start with the open positions as of the end of the month. It often takes a few days to prepare this article, but the screenshots below are from the end of the prior month.
The cell with the ticker is grey if the position is in a taxable account. This was a request by a few members and there was no drawback to adding the information. All of the taxable positions are in equity REITs.
Preferred shares and baby bonds:
Equity REITs:
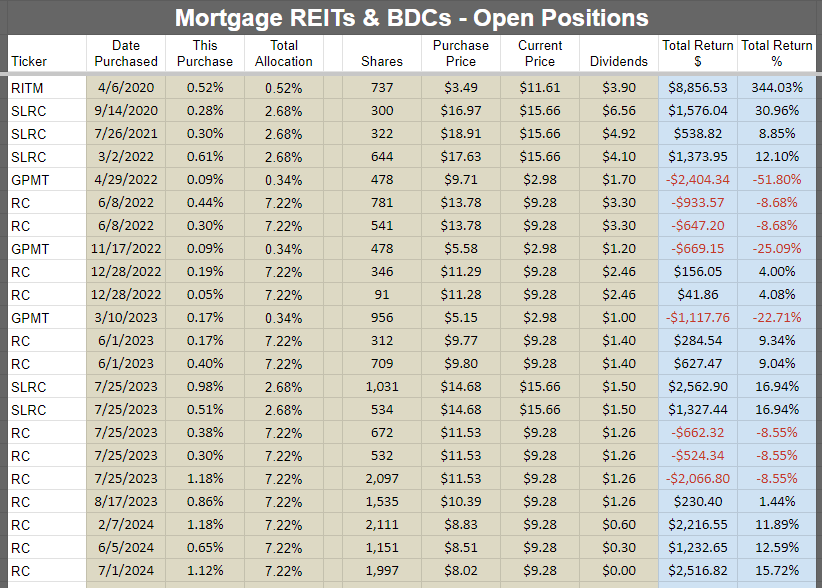
Mortgage REITs and BDCs:
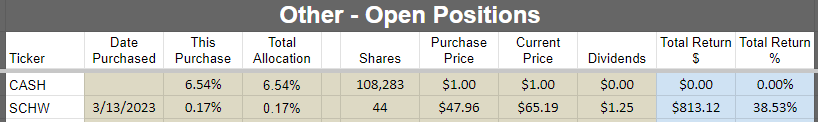
Other:
Subsequent Changes
None so far.
Outlook
The big dip in rates looks very favorable.