


The Big Update on GLPI & Returns Comparison to O and VICI
GLPI is one of the few REITs with a higher AFFO multiple than 5 years ago. That's pretty crazy.

Gaming and Leisure Properties (GLPI) GLPI 0.00%↑ has been severely overdue for an update.
Despite the long time since we wrote about GLPI, this article will be relatively short.
Edit: So much for short. Definitely failed at that objective. Sector comparisons and market implied cap rate dramatically expanded the article.
I’ll be working on VICI Properties (VICI) VICI 0.00%↑ soon.
The gambling REITs (GLPI and VICI) are also a type of net lease REIT. Their contracts are on net lease terms and typically last multiple decades.
However, other net lease REITs do not have huge allocations to gambling properties. Consequently, GLPI and VICI need to be seen as separate from typical net lease REITs.
Note: They prefer to call them “gaming”. Since they don’t own the arenas, but do own casinos, I’m going with “gambling”.
The Dominance of Gambling REITs
We’re starting with the elephant in the room.
If we use a 5-year measurement period, the gambling REITs have smoked the sector (based on total returns).
That’s pretty impressive, given that the pandemic was pretty awful for them.
They bounced back strong and ended up with a solid performance.
Besides delivering strong returns over that period, they also demonstrated (except for the pandemic), lower volatility than many REITs.
They were even less volatile than the net lease REITs.
I wanted to compare VICI and GLPI relative to the net lease REITs and the largest REIT ETF:
Realty Income (O) O 0.00%↑
National Retail Properties (NNN) NNN 0.00%↑
Agree Realty (ADC) ADC 0.00%↑
W.P. Carey (WPC) WPC 0.00%↑
Four Corners Property Trust (FCPT) FCPT 0.00%↑
Essential Properties Realty Trust (EPRT) EPRT 0.00%↑
Getty Realty Corp. (GTY) GTY 0.00%↑
Vanguard Real Estate Index Fund ETF (VNQ) VNQ 0.00%↑
Here is the chart:
It’s been a rough several years for REITs as interest rates surged higher. To evaluate performance, we need to consider both absolute performance and relative performance.
That chart can be a bit much for some investors, so I wanted to include an option where we hide several lines.
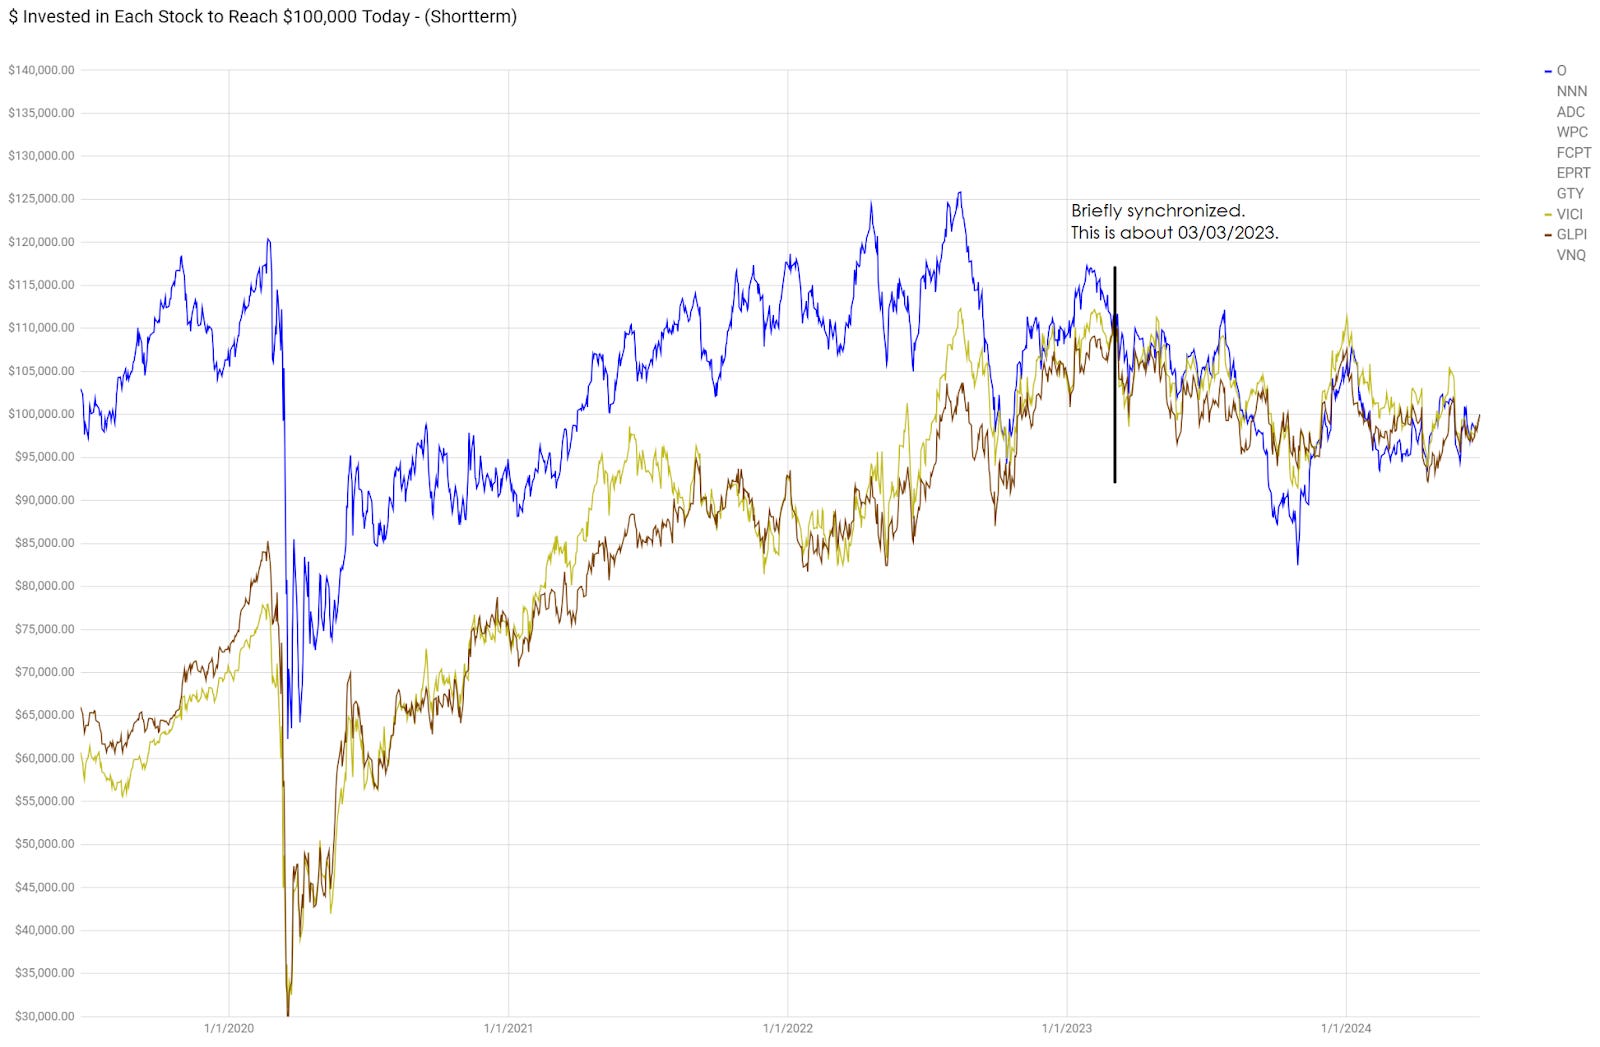
I’ll be using Realty Income for comparison since it’s the best-known net lease REIT.
Using this view emphasizes the extreme correlation in VICI and GLPI. It also demonstrates that the outperformance (relative to Realty Income) ends in early 2023.
So why did GLPI outperform so much?
Did they grow AFFO per share faster?
No.
They grew AFFO per share slower than O. I’ll be using consensus estimates for 2024 AFFO per share in this comparison.
From 2019 to 2024, GLPI grew AFFO per share at a 1.69% CAGR (compound annual growth rate).
During the same period, Realty Income grew AFFO per share at a 4.66% CAGR.
GLPI paid out a moderately larger dividend and had two small special dividends. But it wasn’t enough to offset a difference of nearly 3% in the CAGR.
The big factor here was a change in multiples:

The strong performance for GLPI (and VICI) relative to Realty Income entirely driven by AFFO multiples / AFFO yield. I prepared a chart showing the change in valuation:

That makes it pretty clear.
Realty Income was repriced based on much higher interest rates.
GLPI was not repriced based on interest rates.
VICI was repriced to a slightly lower multiple, but not much.
That’s why GLPI outperformed Realty Income dramatically.
It was not due to the acquisitions or underlying real estate. Those factors drive AFFO per share growth.
We should give GLPI some credit for reducing leverage. When REITs reduce leverage, they should generally (all else constant) see an increased AFFO multiple.
However, leverage is not sufficient to explain such a dramatic shift in relative values.
Note: This is the end of the sector comparisons.
Acquisitions
GLPI is focused on gambling, but the net lease aspect is still important.
GLPI delivers better growth in “per share” metrics when they are able to issue equity and acquire properties.
Recent acquisitions were at 8.3% and 8.4% cap rates.
Those should be accretive.
I checked the terms on the transactions. They looked pretty standard. Long leases. Typical escalators. Renewal options. This is all pretty normal.
Market Implied Cap Rates
I did some rough math. Values in thousands except “per share”.
Debts + accounts payable + accrued interest + accrued salary = $6,724,042.
That’s the value we’re going to use for debts.
Note: There is plenty of room for intelligent analysts to debate exactly which values to include. However, the total values shouldn’t be dramatically different.
Now we need to find the cash.
Cash and equivalents = $211,533.
Investment securities = $343,244.
We’re adding those together to figure out how much non-real estate value is inside the REIT.
Combined non-real estate assets = $554,777
Note: The decision to add in “Investment Securities” may seem strange. However, the 10-Q indicates that these are Treasury securities that mature in August 2024. You should always count Treasuries.
Subtract those assets from the debt and you get $6,169,265.
We’re going to return to that soon.
For equity:
Shares and units outstanding = 279,588.
Price = $44.22.
Total equity market cap: $12,363,391.
Now we’re going to add the bolded values together to get $18,532,656.
That is the market’s implied value for all of the real estate.
Now we look at the first quarter’s cash NOI (Net Operating Income): $343,190.
Annualized that comes to $1,372,760.
Divide the annualized NOI by the implied value of the real estate and you get 7.41%.
That is the market implied cap rate.
That compares favorably with the 8.3% to 8.4% cap rate on recent acquisitions.
Note: These calculations ignore that VICI acquired Tioga Downs Casino Resort during the quarter. Consequently, we only have NOI from it for 60% of the quarter.
I ran an adjustment for that separately and it impacts the market implied cap rate by about 0.03%. Doesn’t matter. That’s way too small to be material.
Price to NAV
I’m going to pause for a moment and throw the consensus NAV of $49.17 in the garbage.
We can alter the prior formula to use the consensus NAV instead of the share price.
That should give us a good idea of the average cap rate analysts are using.
When we alter that formula to use $49.17 instead of the share price of $44.22, we reach an implied cap rate of 6.89% (or 6.92% if we adjust for the timing of acquisitions).
If the recent acquisitions are of comparable quality to the rest of the portfolio (which I see no evidence against), then the portfolio should not be valued based on a 6.9% cap rate.
It would appear that management agrees with our math.
The share price has been under $50 all year. Most of the time it was under $46.
How is the REIT using capital? They are buying new properties.
I agree with management’s decision to focus on acquisitions.
A Reasonable Cap Rate for NAV
I think a more reasonable cap rate would be around 7.9%. Maybe even a bit higher. If we use a 7.91% cap rate (or 7.94% adjusting for the latest acquisition), we would reach a NAV of $40.00.
That’s probably more accurate than the consensus estimate of $49.17.
Maybe The Real Estate Quietly Appreciated?
Since the properties are under long contracts, an investor could reasonably argue that the NOI is lower because much of the property was acquired before the wave of inflation. They would argue that the real estate actually appreciated, but we’re getting a stale number from NOI. Reasonable argument. However, the typical properties are under extremely long lease terms. Often the tenant has renewal options. Therefore, the landlord will be unable to raise the rent for decades.
I’ll use an extreme example to demonstrate the point.
Hypothetically, imagine you have a property with the following traits:
Market rent today would be $16 million per year.
With a tenant at $16 million per year, the property would be worth $200 million (8% cap rate).
Property is leased for 40 years at $2 million per year.
Landlord has no option to break the lease without the tenant doing something outrageously stupid.
How much is that property worth today?
Don’t bother with doing net present value calculations. It’s not worth the hassle. You don’t need to find a precise amount.
The answer is “dramatically less than $200 million”.
Over the next 40 years, assuming no escalators, the tenant would pay $80 million in rent instead of $640 million.
This example is clearly extreme, but it serves to pound the lesson home.
You should recognize:
The long leases have a material impact on the value of the real estate (for better or worse).
When values are falling, the long leases help. When values are rising, the long leases can hurt.
Is there any value in market rents rising after a lease is locked in?
Absolutely. It creates some protection from a weak tenant going bankrupt.
However, that should typically be a very minor part of the portfolio.
Therefore, using cap rates on net lease REITs is good.
Calculating NAV with a 6.9% cap rate when acquisitions are at an 8.3% to 8.4% cap rate looks pretty bad.
I’m inclined to think NAV is probably in the $35.00 to $40.00 range. That’s a 7.9% to 8.6% range for cap rates.
Dividend Growth and AFFO Per Share Growth
Investors like net lease REITs because:
They offer higher dividend yields.
Dividends are typically backed by extremely long net leases.
Some of them have a great history of dividend growth.
A large portion of the growth in AFFO per share is from acquisitions. Net lease REITs typically trade above NAV. They issue shares and debt, then acquire more assets.
The level of dividends a REIT can sustainably pay is tied to their AFFO.
GLPI is at an 81% payout ratio. That’s a bit high. Typical is in the 70s. Therefore, it would be unwise to materially increase the payout ratio.
Paying out 100% is not intelligent unless the REIT has a reason to believe they will see a substantial increase in rental revenue in the near future.
For instance, industrial REITs can pay out 100%. Industrial REITs have shorter lease terms and will be rolling over a large volume of leases to substantially higher rates each year. Therefore, paying out 100% in the current year wouldn’t be remotely concerning.
However, GLPI has already locked in virtually all of the revenue on their existing properties for many years into the future.
They have escalators, but those are typically pretty small. We’re looking at escalators around 1% to 2%.
Now that we know revenues from existing properties should be growing between 1% and 2% annually, we can do some rough modeling.
Holding everything else constant, raising revenues by 1% to 2% per year could drive AFFO per share up slightly more.
Of course, everything else won’t be constant.
Here’s a quick break down:
Higher interest rates will reduce AFFO per share growth rates.
Acquisitions will improve AFFO per share growth rates.
AFFO Before Dividends
Many investors focus on dividends too much. Dividends are important. They deserve a role in the evaluation. However, the AFFO gives us more information about the health of the REIT.
Dividends without cash flow to back them are doomed. So, we want to focus on GLPI’s ability to grow AFFO per share, then use that as a proxy for their ability to grow dividends.
I started by pulling the data from TIKR. That’s usually my first source. But the jump in values for 2020 made me suspicious, so I checked the underlying data.
Note: This did not distort the values in the AFFO multiple chart used earlier. I checked the forward AFFO figures used there.

I determined the 2017, 2018, and 2019 figures for FFO and AFFO per share were incorrect.
Consequently, I had to pull all the data from the company documents and create a new chart:
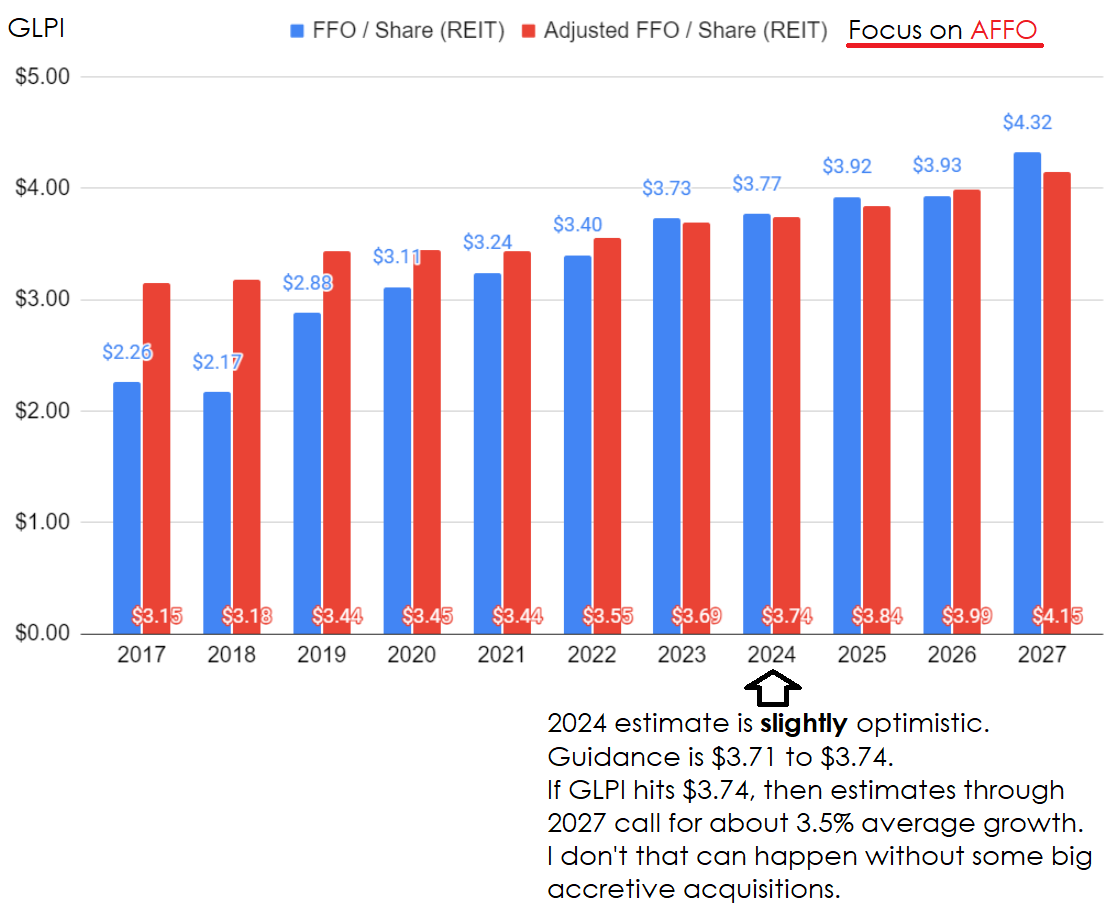
Will GLPI hit $3.74 per share in 2024? Maybe. Maybe not. Anything from $3.71 to $3.75 wouldn’t be a huge surprise.
The part I’m concerned about is the future estimates.
Even if GLPI hits the upper end of the guidance range with $3.74 per share, I don’t think the REIT will average 3.5% growth in AFFO per share.
Past Vs. Future
Consider the following differences.
Growth Rates
2017 to 2024: AFFO per share growth averages about 2.5%.
2025 to 2027: AFFO per share projected growth averages 3.5%.
Note: From 2018 to 2019, AFFO per share growth was about 8.2%. From 2019 to 2024, growth was about 1.7%.
Acquisitions
2017 to 2024: Significant tailwind.
2025 to 2027: Probably a significant tailwind.
Note: If GLPI was using more debt relative to equity, the tailwind would’ve been bigger. Using more equity reduced risk, but also reduced accretion.
Interest Rates
2017 to 2024: Tailwind (except at the end)
2025 to 2027: Probably headwind.
Evaluation
If GLPI found some huge acquisitions at a great valuation, they could hit 3.5%.
However, that’s the optimistic scenario. It shouldn’t be the base scenario.
The base scenario should probably be around a 1.5% to 2.5% growth rate.
Keep in mind that due to the timing of acquisitions, the growth could still be a bit lumpy.
Improved Risk Profile
GLPI achieved a BBB- credit rating as they significantly reduced net debt to EBITDA:
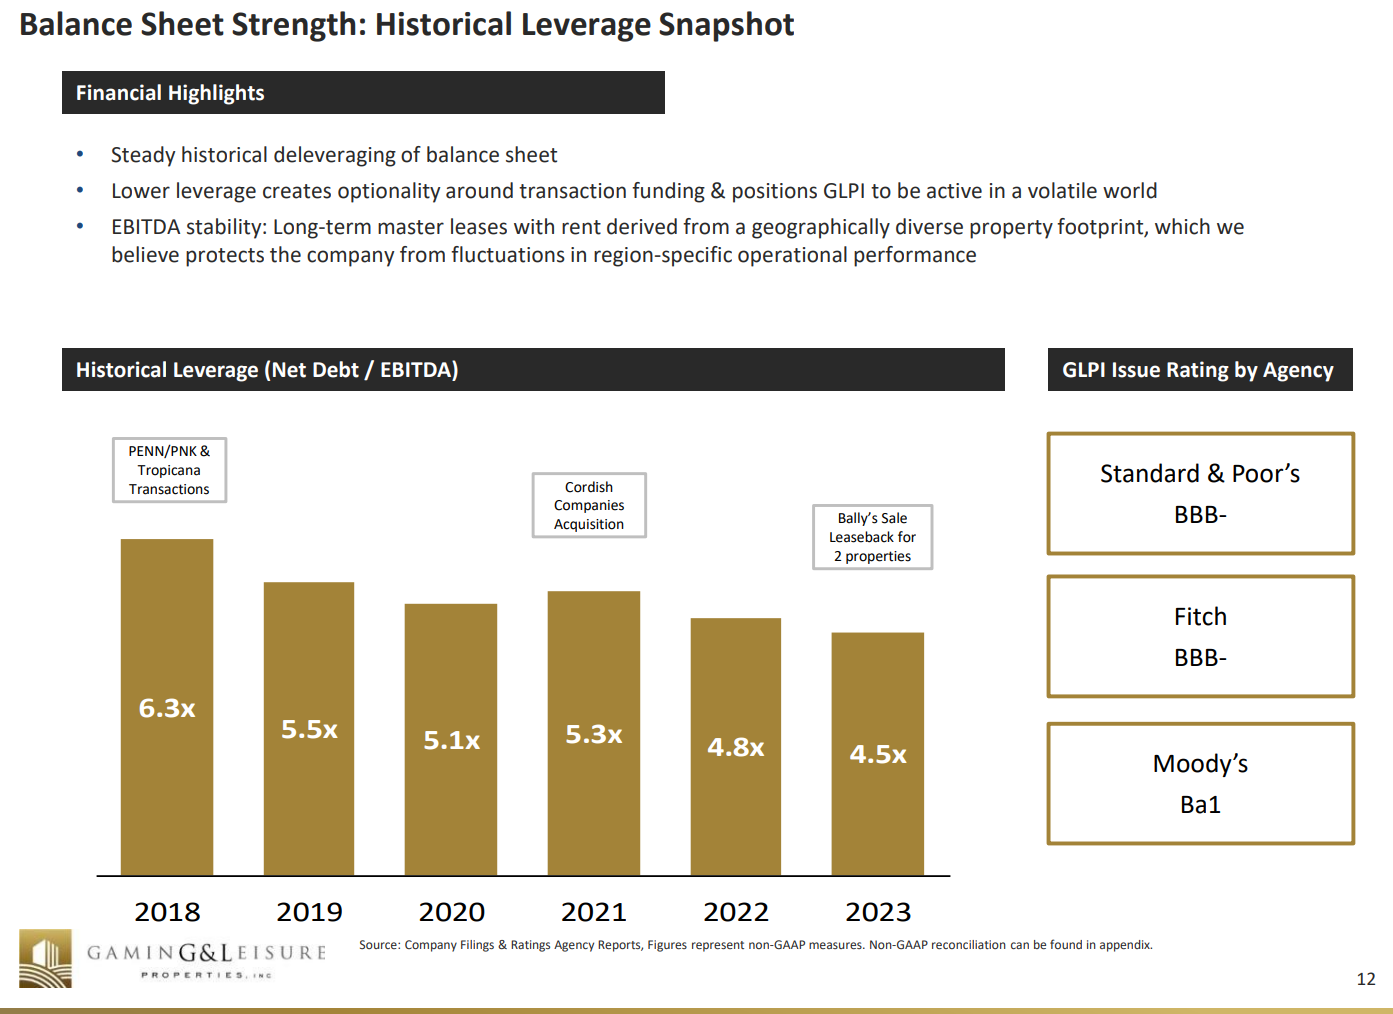
They will also be getting an improved risk rating on our sheet. GLPI is going from 4.0 to 3.5 (lower is better).
The 3.5 rating reflects that they are still pretty risky, but it’s a nice improvement.
The net debt to EBITDA of 4.5x isn’t inherently risky.
A REIT with net debt to EBITDA at 4.5x could land a significantly lower risk rating.
However, such a REIT would own different properties.
The gambling properties owned by GLPI trade at high cap rates (acquisitions at 8.3% to 8.4%).
They have long leases, but the properties are highly specialized. If a tenant goes bankrupt, filling the property could still be a material risk.
Given those factors, GLPI gets a higher risk rating (3.5) than other REITs with similar net debt to EBITDA.
The credit rating agencies appear to agree with that evaluation based on the BBB- rating. It would be higher if the properties were lower risk.
Interest Rates Headwind
Interest rates are a headwind for REITs for a few reasons:
Higher interest rates encourage lower valuation as income investors have more alternatives.
Higher interest rates increase the cost of debt for new acquisitions.
Higher interest rates lead existing debts to roll over to higher rates.
Number 3 is the one we’re focusing on here.
GLPI faces a headwind from debts rolling over to higher rates, but it is a relatively small headwind.
Looking forward to 2028, we can model adjusting all of GLPI’s expiring debts to market rates.
The impact on annual AFFO per share would be about -$.11. That’s slightly under 3% based on 2023 AFFO per share of $3.69.
This is actually pretty small relative to many other REITs.
However, it is still present.
Ironically, the reason this is a smaller headwind for GLPI is not because they have so little debt maturing.
It’s because their expiring fixed-rate debt wasn’t absurdly cheap.
GLPI has been reducing leverage (which is great). Older fixed-rate debts were issued while GLPI had a weaker balance sheet. Consequently, those debts were issued at larger spreads to Treasury rates.
Since they didn’t have particularly low rates on existing debts, rolling those rates over results in a smaller increase in rates.
Dividend Yield and Growth
GLPI’s dividend has an annual rate of $3.04 per share ($.76 per quarter).
They’ve been growing it slightly faster than AFFO per share, resulting in a higher payout ratio.
I believe it would be wise to assume dividend growth reflects AFFO per share growth.
Therefore, I think 2% to 2.5% would be a reasonable estimate.
However, a slight reduction to the payout ratio would still be pretty smart.
At $44.37, GLPI offers a 6.9% dividend yield.
If things go well, investors would be looking for growth around 1.5% to 2.5%.
That’s not a bad deal, but it’s not great either.
Of course, share prices will exhibit some volatility. So, the growth estimates are based on growth in AFFO and dividends.
Target Adjustments

Risk rating change: Reduced from 4.0 to 3.5.
All else equal, a lower risk rating would result in a higher target. That’s a positive factor here, but it’s outweighed the impact of higher rates.
We can see that the vast majority of equity REITs trade at materially lower AFFO multiples today. Yet GLPI didn’t see that compression in the multiple.
That reduces the relative attractiveness of shares.
I see Realty Income at $53.88 as a clearly superior option relative to GLPI at $44.85. O’s multiple is only slightly higher. There should be a bigger gap between the two.
The Gettysburg Address is a speech that U.S. President Abraham Lincoln delivered during the American Civil War at the dedication of the Soldiers' National Cemetery, now known as Gettysburg National Cemetery, in Gettysburg, Pennsylvania on the afternoon of November 19, 1863, four and a half months after the Union armies defeated Confederate forces in the Battle of Gettysburg, the Civil War's deadliest battle. The speech is widely considered one of the most notable and famous delivered in American history.[4][5]
Lincoln's carefully crafted and brief address, which was not scheduled as the day's primary speech, came to be seen as one of the greatest and most influential statements on the American national purpose. In just 271 words, beginning with the now famous phrase "Four score and seven years ago", referring to the signing of the Declaration of Independence 87 years earlier,[6] Lincoln described the U.S. as a nation "conceived in Liberty, and dedicated to the proposition that all men are created equal" and represented the Civil War as a test that would determine whether such a nation could endure. Lincoln extolled the sacrifices of those who died at Gettysburg in defense of those principles and then urged that the nation ensure:
[...] that these dead shall not have died in vain—that this nation, under God, shall have a new birth of freedom[7]—and that government of the people, by the people, for the people, shall not perish from the earth.[8][9]
Despite the prominent place of the speech in the history and popular culture of the United States, its exact wording is disputed. The five known manuscripts of the Gettysburg Address in Lincoln's hand differ in a number of details, and also differ from contemporary newspaper reprints of the speech. Nor is it precisely clear where on the grounds of the Gettysburg cemetery Lincoln delivered the address. Modern scholarship locates the speakers' platform at least 120 feet (37 m) away from the traditional site in Soldiers' National Cemetery at the Soldiers' National Monument, such that it stood entirely within the private adjacent Evergreen Cemetery. A 2022 interpretation of photographs of the day, using 3D modeling software, has argued for a slightly different location—straddling the current fence around Evergreen Cemetery.[10]
Background
The written invitation of David Wills, who led the establishment of Soldiers' National Cemetery, inviting Lincoln to speak at Gettysburg
A Harvest of Death Union soldiers dead at Gettysburg, photographed by Timothy H. O'Sullivan, July 5–6, 1863
Following the Battle of Gettysburg on July 1–3, 1863, the removal of the fallen Union soldiers from the Gettysburg Battlefield graves and their reburial in graves at the National Cemetery at Gettysburg began on October 17, though on the day of the ceremony, interment was less than half complete.[11]
In inviting President Lincoln to the ceremonies, David Wills, of the committee for the November 19 Consecration of the National Cemetery at Gettysburg, wrote, "It is the desire that, after the Oration, you, as Chief Executive of the nation, formally set apart these grounds to their sacred use by a few appropriate remarks."[12]
On the train trip from Washington, D.C. to Gettysburg on November 18, Lincoln was accompanied by three members of his Cabinet, William Seward, John Usher, and Montgomery Blair, several foreign officials, his secretary John Nicolay, and his assistant secretary, John Hay. During the trip, Lincoln remarked to Hay that he felt weak; on the morning of November 19, Lincoln mentioned to Nicolay that he was dizzy. Hay noted during the speech that Lincoln's face had "a ghastly color" and that he was "sad, mournful, almost haggard". After the speech, when Lincoln boarded the 6:30pm train to return to Washington, D.C., he was feverish and weak with a severe headache. A protracted illness followed, which included a vesicular rash; it was diagnosed as a mild case of smallpox. It is highly likely that Lincoln was in the prodromal period of smallpox as he delivered the Gettysburg Address.[13]
After arriving in Gettysburg, which had become filled with large crowds, Lincoln spent the night in Wills's house. A large crowd appeared at the house, singing and wanting Lincoln to make a speech. Lincoln met the crowd but did not have a speech prepared, and he returned inside after saying a few extemporaneous words. The crowd then continued to another house where Secretary of State William Seward delivered a speech. Later that night, Lincoln wrote and briefly met with Seward before going to bed at about midnight.[14]
Program and Everett's "Gettysburg Oration"
Edward Everett, who delivered a two-hour oration before Lincoln's short remarks
The program organized for that day by Wills and his committee included:
Music, by Birgfeld's Band[15] ("Homage d'uns Heros" by Adolph Birgfeld)
Prayer, by Reverend T. H. Stockton, D.D.
The Marine Band ("Old Hundred"), directed by Francis Scala, provided music at the dedication.
Oration, by Hon. Edward Everett ("The Battles of Gettysburg")
Music, Hymn ("Consecration Chant") by B. B. French, Esq., music by Wilson G Horner, sung by Baltimore Glee Club
Dedicatory Remarks, by the President of the United States
Dirge ("Oh! It is Great for Our Country to Die", words by James G. Percival, music by Alfred Delaney), sung by Choir selected for the occasion
Benediction, by Reverend H. L. Baugher, D.D.[12]
While it is Lincoln's short speech that has gone down in history as one of the finest examples of English public oratory, it was Everett's oration that was slated to be the "Gettysburg address" that day. His now seldom-read oration was 13,607 words long[16] and lasted two hours.[17]
Lengthy dedication addresses like Everett's were common at cemeteries in this era. The tradition began in 1831 when Justice Joseph Story delivered the dedication address at Mount Auburn Cemetery in Cambridge, Massachusetts. Those addresses often linked cemeteries to the mission of Union.[18]
Text
Shortly after Everett's well-received remarks, Lincoln spoke for only a few minutes.[19] His speech was ten sentences long.[citation needed]
Despite the historical significance of Lincoln's speech, modern scholars disagree as to its exact wording, and contemporary transcriptions published in newspaper accounts of the event and even handwritten copies by Lincoln himself differ in their wording, punctuation, and structure.[20][21] Of these versions, the Bliss version, written well after the speech as a favor for a friend, is viewed by many as the standard text.[22] Its text differs, however, from the written versions prepared by Lincoln before and after his speech. It is the only version to which Lincoln affixed his signature, and the last he is known to have written.[22] The Bliss version is as follows:
The process for making an account to post a comment was really stupid.